
Hey everyone,
something happened a couple of weeks ago that left me exasperated, shaking my head in disbelief, and wondering yet again just why humans as a species are such unquestioning, gullible dopes.
Yep … I finally sat down and watched Robert Lustig’s “Sugar: The Bitter Truth” video.
From beginning to end.
Ugh.
The current wave of sugarphobia owes much to this video, which is a recording of a lecture Lustig delivered to a live audience on May 26, 2009.
Lustig has also written a New York Times bestseller titled Fat Chance: Beating the Odds Against Sugar, Processed Food, Obesity, and Disease. In doing so, the clearly overweight Lustig joins the long list of best-selling anti-carb gurus who loudly proclaim to know the cause and solution to the obesity epidemic, all while sporting prodigious waistlines themselves, including the late Dr. Robert Atkins, Gary Taubes, and the girdle-wearing Michael Eades.

Despite the absurdities inherent in an overweight guy presenting himself as an ‘expert’ on obesity prevention, Lustig’s video promptly went viral. As I sit here editing the words you are reading, it is 7:47am Australian EST, December 21, 2015, and the Youtube video of Lustig’s lecture is showing 6,093,126 views since it was posted in 2009. Thanks to the video’s popularity, Lustig has become a media darling, the go-to ‘expert’ for journalists who need an alarmist quote or two to spice up their stories about “white poison”.
Which is most unfortunate, because most of what Lustig says in the video is complete nonsense.
Easily Offended? Adios!
Before we continue, I need to issue a warning: If you don’t like the word “bullshit”, you’d better close this page now. There is so much bovine excrement in Lustig’s speech, this article can’t help but give the BS word a frequent airing.
This article is unforgiving towards Lustig and the nonsense he preaches. I have no qualms in adopting such a tone for this article, because Lustig himself is quite scathing towards those of us with a firm grip on reality who correctly point out the obesity ‘epidemic’ was caused by a calorie surplus:
By the end of this article, you should have no illusions as to why it is Robert Lustig who needs to “get real!”
So if you’re one of these obnoxiously hypocritical folks who quietly sits by while people like Lustig get rich peddling hogwash and heaping scorn on those who dissent, yet suddenly get your panties in a twist when I dare call bullshit on their absurd claims, leave this site immediately.
The Bitter Truth about Lustig’s “Bitter Truth” Video
According to the blurb at the UCTV website, Lustig “argues that fructose (too much) and fiber (not enough) appear to be cornerstones of the obesity epidemic through their effects on insulin.”[6] However, as anyone who has watched the video will know, Lustig proceeds to blame sugar and fructose for a heck of a lot more than just the obesity ‘epidemic’.
After a preamble in which the paunchy Lustig promises his audience a little bit of everything but sex, but then offers “well, we can see what we can do about that too” (it seems long, lonely nights researching the ‘nuances’ of fructose metabolism can do strange things to a guy), he gives his audience a “quiz” to get them “in the mood.”
That ‘quiz’ is comprised of a single question:
“What do the Atkins Diet and the Japanese Diet have in common?”
If you said “@#$% all!”, you’re right.
However, according to our frisky anti-fructosian, the answer is that “they both work” (at what, he doesn’t say) and “they both eliminate the sugar fructose.”
The implication being that two polar opposite eating patterns, one high in fat and low in carbs, the other high in carbs and lower in fat, both show efficacy at, well, something, because they both “eliminate” fructose.
Rubbish.
In 2009, the same year Lustig gave his lecture, there was indeed significant consumption of fructose in the Japanese diet. Anyone with an Internet connection can easily verify as much for themselves by visiting the Food and Agriculture (FAO) website, and checking the per capita intake of sweeteners in Japan for that year. Do that, and you’ll see the Japanese were averaging 52 calories per day from fruits, and a far more significant 174 calories daily from sugar. “Sweeteners, Other” and “Honey” supplied another 86 cals/day[7].
So just from sugar alone, the Japanese were obtaining 22 grams, or 4.4 teaspoons, of fructose per day. The Japanese do indeed eat fructose-containing sugar, and have been doing so for hundreds of years[8].
Which means the opening statement of Lustig’s lecture – the one that has garnered him so much fame and media adulation - is complete garbage.
Dodgey Lustig Claim: “There is no Fructose in the Japanese Diet”.
Verdict: Bullshit.
Why Are Americans Fatter than the Japanese?
The Japanese diet is in no way fructose-free, as Lustig falsely claims. Granted, Americans eat more sugar than the Japanese, but guess what? They also eat 1,000 more calories per day!
Yes ma’am: The same FAO data we just checked out shows that in 2009, the average per capita energy intake in Japan was 2,674 calories/day. The corresponding figure for the USA was 3,652 calories/day[7].
You think that might have something to do with why Americans are carting around so much more chub?
Duh.
Getting Rotunder Down Under
Australians are not included in the “racial innuendo” Lustig promises at the start of his video. But it behoves me to quickly discuss the residents of this here sunburned country, because Australia's experience with sugar completely undermines Lustig’s make-believe claims about sugar and weight gain.
According to the old Men at Work hit, here in the land Down Under“the women glow and men chunder.” But that song was originally released in 1980; sadly, there are far less women giving off a healthy glow here in Australia nowadays, thanks to soaring obesity rates. On a brighter note, I haven’t seen any men chunder for a long time, so I guess it’s not all bad down here.
What does “chunder” mean, I hear all you non-Australians asking?
It means “to vomit”.
Why, I hear you further asking, did Men at Work include a line about vomiting when writing their hit song?
I have no idea.
I mean, it's not like you head off to work here in Australia and from the bus window see guys throwing up everywhere.
By the way, no-one actually uses the word “chunder” here anymore. Nor, for crying out loud, do we say “bonza!”, “you little ripper!”, “strewth!”, or “cooee cobber!”
Why not?
For the same reason you Americans no longer walk around in cowboy boots greeting each other with “Howdy pardner!”

Countries change. But sadly, there was one change Australia enthusiastically embraced that it really shouldn’t have:
Obesity.
The old image of Aussies as sun-bronzed, sports-loving, outdoor-dwelling people is, quite frankly, a load of shit. Don't get me wrong: Australians love talking about sports. They watch sports, they talk about sports, they watch other people talk about sports on TV, they read about sports, they argue about sports, in fact they just DON'T FUCKING SHUT UP ABOUT SPORTS. But heaven forbid most of them get off their own larvae-white asses and actually do some exercise. "Yeah, nah, sounds too much like 'ard work, mate!"
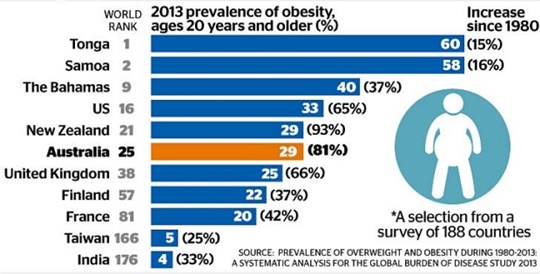
As a result of their armchair-athlete tendencies, Australians are now one of the most obese populations in the world. In an extensive survey of 188 countries published in Lancet in 2014, Australia ranked as the world’s 25th fattest country (Tonga received the dubious honor of #1 spot, while the US came in 16th)[9].
And it sure as heck was not an increase in sugar intake that led to the plumpification of Australia.
The Australian ‘Paradox’
In 2011, Australian scientists analysed the trends in obesity and sugar consumption in Australia, the UK, and USA over the past 30 years. The analysis was far-reaching: Data on consumption of sugar in all three countries were obtained from the Food and Agriculture Organization for the years 1980-2003, and further data for Australian sugar intake was obtained from various sources including governmental organizations, industry groups and the country’s two biggest supermarket chains (Coles and Woolworths). Obesity statistics for children and adults were obtained via published national surveys.
Here’s what they found: In Australia, the UK and USA, per capita consumption of refined sucrose decreased by 23%, 10% and 20% respectively from 1980 to 2003. When all sources of nutritive sweeteners, including high fructose corn syrups, were considered, per capita consumption decreased in Australia (−16%) and the UK (−5%), but increased in the USA (+23%).
Furthermore, there was a reduction in Australian sales of sweetened beverages by 64 million litres from 2002 to 2006 and a reduction in the percentage of Australian children consuming sugar-sweetened beverages between 1995 and 2007.
Despite this, the prevalence of obesity increased threefold in Australia since 1980.
The findings confirmed what the Aussie researchers labelled an “Australian Paradox” – a substantial decline in refined sugar intake over the same period that obesity increased markedly.
As the researchers noted, “the implication of these findings is that efforts to reduce sugar intake may reduce consumption but may not reduce the prevalence of obesity.”[10]
That’s because blaming single foods or macronutrients for the obesity ‘epidemic’ draws attention away from the real cause: A caloric intake that is in excess of one’s caloric requirements.
Oh, and while Lustig would have us believe anyone who dares refute the prevailing anti-sugar sentiment must be on the payroll of Big Sugar[4], the Australian analysis was an independent endeavour supervised by professors Alan Barclay and Jennie Brand-Miller. The latter is one of the pioneers of the glycemic index (GI) concept, and has written numerous articles and books championing low-GI foods and diets. She therefore has little incentive to enhance the public image of high-GI sugars.
Interestingly, Lustig never mentions this study. I wonder why?
Dodgey Lustig Claim: ‘Sugar Caused the Obesity Epidemic’.
Verdict: Bullshit.
Less Sugar, Less Physical Activity = More Obesity (You Figure it Out).
Unlike the US rise in obesity, which stems from both declining activity and a marked increase in per capita caloric intake[11, 7], Australia’s rise seems to have been caused almost entirely from decreasing physical activity.
Pretty piss-poor for a nation that just WON'T SHUT UP ABOUT SPORTS.
The FAO data show that daily per capita caloric intake in the US rose from 3,178 in 1980 to 3,780 in 2003. The corresponding figures for Australia are 3,054 in 1980 and 3,116 in 2003. So while daily caloric intake has risen a hefty 600 calories in the US, it has barely changed here in Australia.
Which isn’t surprising. Ask any Aussie returning from a holiday in the US, and they’ll tell you how there seems to be a take-away food outlet on every corner in LA and New York, and how restaurant meals over there are remarkably cheap and big.
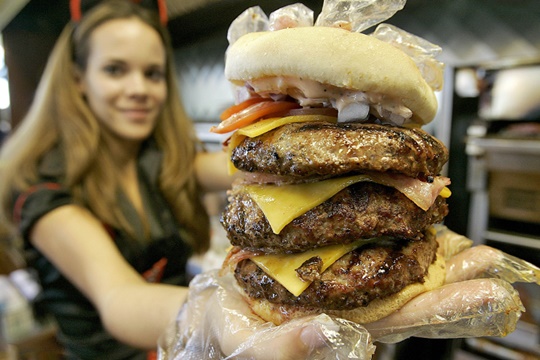
Here in Australia, we have nowhere near as many take-away food outlets as the US, nor do we have the same proliferation of cheaply priced meals containing massive servings.
But while Australians have shunned the supersized dietary approach, physical inactivity has hit this country with a vengeance. Surveys show that, thanks to decreasing activity, Australian kids are performing worse in skills such as kicking, throwing, catching and jumping - collectively known as Fundamental Movement Skills - than they were 30 years ago. And not only are Australian children performing worse than their older siblings and parents did at a similar age, but 90% of them are also scoring below average when compared to American children of the same age[12].
So while America’s caloric surplus came from both eating more and moving less, Australia’s came almost entirely from moving less. A lot less.
Gee, thanks Playstation.
 Over the last 30 years, Australian kids have gotten fatter, slower and unfitter. Which is sad, because quick reflexes are a definite asset here in Australia.
Of course, Lustig furiously denies that “Calories In, Calories Out” (CICO) has anything to do with the historically recent rise in obesity rates. In a 2013 Australian TV program that laughably refers to itself as a ‘science’ show, Lustig angrily insisted CICO “is how we got into this mess”.
The indignant pediatrician then completely refuted himself a moment later when he admitted that Americans were indeed eating more than they were in the 1980s[13]. And at 7:30 in his “Bitter Truth” video, Lustig acknowledges to his audience: “We are all eating more now than we did 20 years ago.”[4]
So which is it? Are Americans eating more than they were in the 1980s, or are they not?
Actually, Lustig has already answered that question for us. Or at least he’s tried to. Unfortunately, in doing so he’s fallen back on his usual tactic of disingenuous assumptions and selective citation.
Lustig: Americans Eating More Carbs! Reality: Americans eating More Carbs, Calories and Fat.
Lustig admits Americans are eating more calories but then, like his cohort Gary Taubes, claims all these extra calories have from carbs, and that therefore carbs caused the obesity epidemic.
There are two major problems with this assertion.
The first is that even if the extra calories were coming entirely from carbs, this does not even begin to prove carbs are fattening. An increase in caloric and carbohydrate intake during the same period clearly constitutes two (2, II, dos, due, deux) independent variables, either of which could thus be solely or jointly responsible for the increase in obesity. One of the first rules of good science is to isolate your variables. And the way to isolate a variable is to test it under tightly controlled circumstances under which all other potentially confounding variables are held constant. Isolating your variables does not mean simply picking the one that best suits your argument and claiming it is the causal agent, without even bothering to test it!
That I even need to explain this to a practicing doctor/professor who lectures to impressionable young students at a major Californian university is a sad, sad reflection of the terribly poor standard of modern health science education.
As it turns out, research examining the effect of keeping overall caloric intake constant but manipulating the amount of dietary carbohydrate intake goes back as far as 1935. And it overwhelmingly shows that diets low in carbohydrate offer absolutely no fat loss advantage over isocaloric high carbohydrate diets (all explained at length in Chapter 1 of The Fat Loss Bible and also touched upon here and here).
The second problem is that Lustig’s assertion the US increase in per capita caloric intake came entirely from carbs is … wrong. This assertion relies upon the selective citation of supportive data, and the blatant ignoring of far more reliable but non-supportive data showing an increase in carbohydrate and fat intake.
As I explained at length in this article, US dietary intake data comes from two primary sources, each employing starkly contrasting methodology.
The largest, and oldest, source of US food intake data comes from the USDA. The USDA determines the total amount of food available in the US, then calculates what remains available for human use after deducting exports, farm and industrial uses, and end-of-year inventories. This amount is then divided by the population of the US to give a per capita “food disappearance” figure.
The obvious flaw of food disappearance data is that it can't account for food wastage; both food outlets and households discard significant amounts of food due to expiration, spoilage and incompletely consumed meals. As a result, USDA food disappearance data tends to overestimate individual caloric and macronutrient intakes. However, because it uses the same methodology and the same sample (the entire United States) each year, the USDA data has one very powerful advantage – consistency.
The second source, the one readily embraced by folks like Taubes and Lustig, comes from the Centers for Disease Control and Prevention (CDC). In his regrettably influential infomercial Good Calories, Bad Calories, Taubes cites a 2004 CDC article reporting that since 1971, total fat intake increased among women by a mere 6.5 grams but decreased among men by 5.3 grams[14]. This gives the impression overall fat intake has remained relatively unchanged.
Thus, we have:
1): USDA data showing a substantial increase in calories, fat and carbohydrate (along with a rather negligible increase in protein) during the period spanning from the early 1980s to 2000;
2): CDC data purporting to show an increase in carbohydrate intake, but no real increase in fat intake during the same period.
The obvious question is why do the USDA and CDC data deliver differing intake data for the US population? The obvious answer is that they use totally different methods of data acquisition.
The calorie, carbohydrate and fat intake changes reported by the CDC were derived from its National Health and Nutrition Examination Surveys (NHANES) that track food consumption trends. Unlike the USDA’s food disappearance data, these surveys involve face-to-face interviews with relatively small samples of randomly recruited US citizens. In other words, they rely on the ability of people to accurately and truthfully recall their food intake, and they involve only a small portion of the US population.
Which is a massive flaw, because misreporting is not the exception but the norm in dietary surveys[15]. Hence, it doesn’t take an intellectual giant to begin to see why there could be serious issues with the NHANES data.
In contrast to the USDA data, which covers the entire US population, in NHANES the sample sizes ranged from 14,167 men and women in NHANES III (1988-1994), to only 3,733 men and women in NHANES 1999-2000[14]. In what some would consider a rather substantial leap of faith, these disparate samples were then assumed to be representative of the entire US population.
Each of the men and women from these samples took part in a single dietary recall interview about the foods and beverages they consumed during the preceding 24 hours; this 24-hour recall was then assumed to be a reliable representation of each subject’s diet for the 1- to 6-year periods covered by each NHANES project.
Yep, there’s a lot of assuming going on with the NHANES dietary data.
And that assuming is thoroughly misplaced, as researchers from the University of South Carolina confirmed in 2013. They carefully scrutinized the NHANES caloric intake data to see just how reliable it was, and found it was anything but.
They calculated the NHANES subjects’ BMIs using an established and reliable formula (the Schofield equation), then applied a multiplier of 1.35 to allow for a level of activity typical of a normal, organically healthy, free-living individual. Any reported energy intake in a NHANES subject that fell below the amount predicted by the Schofield + 1.35 multiplier combination was considered implausible and indicative of under-reporting.
So what did they find?
Rampant under-reporting, that’s what.
The mean reported energy intakes for each and every NHANES were implausible. This included NHANES I, II AND III – which covered the period in which the rapid rise in obesity occurred – and the six subsequent NHANES covering the period 1999 and 2010.
The disparity between self-reported caloric intakes and minimal required energy intakes was much higher among overweight subjects, and even higher again in the obese subjects. As the authors noted, at no point in the history of the NHANES did more than 43% of overweight and obese women report plausible values. The corresponding figure for overweight and obese men was 49%[16].
Unlike NHANES, the USDA data does not involve food recall surveys, and therefore is not prone to the well-established phenomenon of under-reporting and recall bias.
Unlike NHANES, which involves small, random fragments of the US population, which vary in size, the USDA data always involves nationwide data encompassing the whole of the United States.
Despite the inherent superiority in the methodology used to derive the USDA data, folks like Lustig and Taubes blatantly ignore it, and instead repeatedly cite the highly dubious NHANES data.
Dodgey Lustig Claim: ‘Caloric Intake Has Increased Since the 1980s, But Solely From Carbohydrates. Therefore Carbohydrates Caused the Obesity Epidemic!’
Verdict: Bullshit.
“The Coca-Cola Conspiracy”
At 13:07 in the video, things get really silly. This is where Lustig accuses Coca-Cola of a conspiracy. One that allegedly involves spiking Coke with sodium and caffeine in order to make people thirstier, and hence drink more Coke. He calls this “The Coca-Cola Conspiracy”.
“It’s like drinking a pizza”, he says.
Gee, that’s interesting, because I’ve drunk Coke and I’ve eaten pizza, and they are absolutely nothing like each other.
But Lustig has no doubt Coca-Cola pizzafied their flagship beverage, and that they did it deliberately. “They knew what they were doing,” he says all-knowingly of the soft drink giant.
Reality check: If Coca-Cola’s conspiratorial plan was to stimulate further sodium-induced thirst in its customers, then the company clearly had no idea what it was doing. Either the same brains trust that brought us the New Coke flop was given the task of implementing this conspiracy, or Lustig is simply feeding us another load of hogwash.
My money’s on the latter.
Let’s look at the plain facts: A 12 oz can of Coke contains a mere 45 mg of sodium – a fraction of the (sodium-phobic) official US Daily Recommended Intake of 1200 mg and 1500 mg for children and adults, respectively[17,18].
To put this piddling amount into even better perspective, a teaspoon of table salt contains 2,325 mg of sodium[19]. So the amount of table salt required to deliver the same amount of sodium in a 12 oz can of Coke would be 0.019 of a teaspoon.
If you honestly think consuming such a microscopic serving of sodium is going to trigger thirst, let alone a craving for cola, then … you’re probably Robert Lustig.
If the “drinking a pizza” analogy is now starting to sound especially stupid … it is. A single slice of Domino’s pizza contains between 150-420 mg of sodium; a slice of Pizza Hut Pepperoni pizza contains 764 mg[20,21].
Needless to say, that’s a damn sight more sodium than you’ll find in a can of Coke.
By the way, eating that entire 14” Pizza Hut Pepperoni pizza would supply you with a mighty 6,145 mg of sodium – you’d need to drink 136.5 cans of coke to obtain that same amount of sodium! To claim that drinking a can of Coke is like “drinking a pizza” is a shameless display of laissez-faire bullshit.
And the diuresis-inducing amount of caffeine that Lustig alleges is in Coke? Well, that same 12 oz can of Coke also contains a modest 34 mg of caffeine. Contrast that with a tiny 1oz espresso, which contains 63 mg[22]. Yep, the espresso delivers almost twice the caffeine in 1/12th the volume of fluid!
Your grandmother and her friends get a bigger caffeine hit at their afternoon tea gatherings.
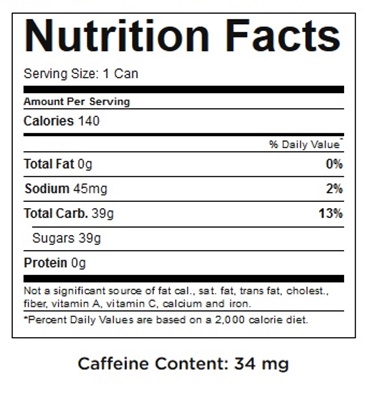 Nutrition Facts for a 12-ounce can of Coca Cola.
Lustig’s absurd conspiracy theory doesn’t even begin to hold. After looking at the actual figures, it becomes evident that drinking a can of Coke is like … drinking a can of Coke.
And listening to Robert Lustig is like drinking the Kool-Aid … or an excruciating exercise in bullshit tolerance, depending on your intelligence and gullibility. The guy brings forth all manner of outlandish theories in order to absolve people (and himself, no doubt) of any responsibility for their own portly state. Nope, you didn’t get fat because you ate too much and/or did too little activity – according to Lustig, you have been “poisoned”, the poor “victim” of “The Coca Cola Conspiracy”. You’ve been helplessly swept up in a “typhoon” caused by an “evil” “toxin” that is as “addictive” as cocaine and heroin and as socially destructive as alcohol.
Give me a fucking break.
Here’s the simple truth about sugar: It tastes good.
That’s it. It tastes good, and eating foods containing it feels good. And like anything that makes people feel good – sex, eBay, drinking, eBay, lying in the sun, eBay, partying, eBay, sipping espressos, eBay, shopping (did I mention eBay? Damn it feels g-o-o-d scoring a brand new pair of R.M. Williams boots for only $90! Woohoo!) – the potential is always there to take things too far. The onus is on the consumer to act like a grown-up and keep a lid on their consumption, instead of wanking on about “pleasure centres” and being poor innocent “victims” of a soft drink company’s make believe “conspiracy”.
 “The R.M. Williams Conspiracy”: In 1932, an Australian swagman called Reginald Murray Williams formed the R.M. Williams company and started making boots. His diabolical plan was to make them so attractive and of such high quality, that … wait for it … people would want to buy more! Sure worked on me.
As for kids - why are American adults feeding them so many sugar-laden foods and beverages? Children cannot access sugar-rich foods or beverages without the explicit aid of adults. Children do not run school canteens, do not install vending machines in schools, and in most instances do not pack their own lunchboxes. Has your kid just run a half-marathon? No? Then why are you giving him a soft drink, or even a big glass of juice (which has the same glycemic effects as soda due to its high natural sugar content)?
Grow the hell up, folks.
Dodgey Lustig Claim: Coca Cola Conspired to Make Coke As Thirst-Inducing as a Salty, Caffeine-Laced Pizza.
Verdict: Bullshit.
More Nonsense About the Japanese & Italians
Lustig considers sugar a ‘toxin’ and wants governments to impose regulations taxing it and restricting its use. Well, I consider bullshit to be a toxin, so if Lustig is successful in convincing governments to force yet another tax and more idiotic laws upon us, then I’m going to demand governments force a new law upon Lustig, along with his anti-carb cohort Gary Taubes:
Namely, ban them from saying anything about Italians (and in Lustig’s case, I’d insist upon adding the Japanese to the list). Because every time they do, what spews forth is utter bullshit. And as a person of Italian descent, I get a little tired of hearing people like Taubes and Lustig making statements about my ancestors that I know to be complete garbage.
In Part 1, we learned how in 2012 Lustig made the outrageous claim that Americans invented pasta, and introduced it to the Italians after WWII. Never mind that the first documented mention of pasta was in Sicily in the 1100s - a long bloody time before WWII kicked off!
That was hardly the first time he’d made such a stupendously stupid claim about Italians. In his “Bitter Truth” lecture, Lustig claimed Italians don’t eat sugar.
Madonna mia!
Check him out at 34:05, when he starts banging on about Ancel Keys’ Six Countries Study (which he mistakenly refers to in the video as the “Seven Countries Study”, a later and much larger study of which Keys was head researcher).
Noting that Japan and Italy had lower rates of CHD than Australia, England/Wales, Canada, and the US, a scowling Lustig reiterates his fallacious claim that there is no fructose in the Japanese diet:
“Didn’t I tell you the Japanese diet eliminates fructose?”
Yeah, you did Robert - and you were 100% wrong.
But as usual, Lustig is blissfully indifferent to the fact that he is once again floating off into la-la land, and continues:
“They never even had it until we brought it to them after World War Two.”
Oh boy.
Here we go again: Lustig again claiming Uncle Sam introduced a foodstuff to a foreign population after WWII, when in fact that population was already consuming that foodstuff several hundred years earlier.
History clearly isn’t one of Lustig’s strong points.
"Documents show that sugar was first brought to Japan from China in the mid-eighth century as a luxury used mainly as a medicine. The primary source of sweetening in ancient times was either maltose candy or amazura ivy extract. As trade with the continent flourished from the fourteenth to seventeenth centuries, imports of sugar increased and its use expanded as a sweetener used in cooking. The practice of the tea ceremony spread among the upper classes during this period, and sweets made with sugar were developed to accompany the tea. The tradition of sweets that evolved along with the tea ceremony—virtual works of art created from sugar—form a culture of confectionery that Japan can be proud of. It was not until the eighteenth century, however, when sugar cane began to be cultivated in Japan, that sugar became more readily available to the common people." - Dr. Takashi Yamamoto, Osaka University[8].
Okay, fellow readers of Italian descent, take a deep breath, spray on the bullshit-repellent, and hang tight, because now it’s our turn to once again be lied about. After finishing with the Japanese, Lustig turns his creative instincts towards sugar consumption in Italy:
“Italy? Aside from gelato, I mean, what else they got?”
Gee, let me see …
Angel wings, Barbajada, Baxin, Budino, Cannoli, Cassata, Cavallucci, Chinotto, Crostata, Marzipan, Neapolitan ice cream, Nutella, Panforte, Panettone, Sfogliatelle, Tartufo, Tiramisu, Zippuli … not to mention the endless array of biscotti on display in Italy’s countless cafes.

Cannoli: One of the reasons why I love my Italian heritage 🙂
Oh, and were you aware the Italians have been reputed to drink a beverage known as coffee, and … wait for it … to put sugar in that coffee?
No, I’m serious!
What else have the Italians got, Robert?
A lot.
“There is no sugar in the Italian diet”, Lustig confidently asserts.
Yeah, sure. And there are no scooters in Rome, no gondolas in Venice, no paintings in Florence, and no crime in Naples.


Q: What do the Japanese diet and the Italian diet have in common?
A: Robert Lustig doesn't have the slightest clue about either of them.
Perhaps realizing this claim might be pushing the boundaries of credulity even among his captive and unquestioning audience, Lustig quickly adds the following qualification:
“Other than the occasional sweet, which they moderate.”
Replace “occasional sweet” with “regular sugar consumption”, but place extra emphasis on “moderate”, and maybe Lustig will find himself a damn sight closer to the truth.
Because moderation is the whole point in this sugar debate. The reason Italians (and French and Spanish) can eat sugar far more than just “occasionally” yet remain slimmer and enjoy lower rates of CHD and greater longevity than their American counterparts is because they “moderate”, not just sugar, but their overall diet and lifestyle.
Moderation, by the way, does not mean you only eat something once a month – you can eat something on a daily basis yet still exercise moderation in doing so.
This whole concept seems to completely bypass Reverend Lustig, who is hopelessly infected with the extreme either-or mentality so pervasive in the Anglo-Western world. Robert, you really need to break out of your little Anglo-American cocoon, apply for a passport, book an international flight, and go expose yourself to some different cultures.
Wait, poor choice of words: “Expose yourself” in Southern Italy and you’ll likely get stabbed. What I meant was go immerse yourself in other cultures. By doing so, you’ll see first-hand how people in other countries really live and eat. Then maybe you can stop subjecting the public to intelligence-insulting anecdotes about foreign cultures that have absolutely no basis in reality.
Dodgey Lustig Claim: “America Introduced Fructose to the Japanese; there is No Sugar in the Italian Diet”
Verdict: Stronzate! (Italian for “Bullshit!”)
Stone Age Humans, Fibre and Carbs
If Lustig’s commentary at 41:10 is correct, Stone Age humans must have been an incredibly flatulent bunch:
“We as human beings, walking the Earth 50,000 years ago, used to consume one hundred to three hundred grams of fibre daily. We now consume twelve.”
What Lusting is doing here is employing the Appeal to Paleo argument. Namely, if our prehistoric ancestors did something, we should do it too because that must be what we evolved to do.
I agree there’s much potential benefit in studying Paleolithic populations in order to understand where we’ve come from, so to speak, and how this may or may not affect our current physiological and cognitive responses to our modern environment. What I don’t like is the way every brand of diet shill seems to want to hijack the “Paleo” concept, ‘customize’ it (i.e. make shit up about it) to suit their own dogma, then claim their version of How Humans Evolved to Eat!® is how we all should be eating.
In this case, Lustig is claiming that our Paleolithic forebears ate massive fibre intakes, the implication being that we therefore evolved to thrive on such hefty fibre intakes … but we now only consume small amounts, and are thus out of step with our evolutionary programming.
Sounds good on paper, but it’s a load of crap. A big, fibrous, roughage-filled bolus of crap.
Lustig insists carbohydrates make us fat, but here he is claiming huge (and unverifiable) fibre intakes for our Stone Age ancestors that could only have occurred in the presence of some mighty big carbohydrate intakes. Animal foods, remember, contain no fibre.
To be fair, other researchers have claimed some pretty sizeable fibre intakes for hunter-gatherer and prehistoric humans. At the plausible end of the spectrum are 80-130g/day intakes cited for Australian Aborigines; at the “You’re kidding, right?” end of the spectrum are intakes of up to 250g/daily cited for prehistoric Americans who lived in what is now Texas[23].
Given the massive plant food intakes that would be required, I’m inclined to call bullshit on any claim that prehistoric Homo sapiens consumed fibre intakes of 250-300 grams on a daily basis. If you disagree, then be my guest: Go ahead and consume these kinds of daily fibre intakes yourself, and see what happens.
Before you do, you might want to renovate your restroom, because you’ll be spending a lot of time there. Happy stomach cramps!
But if ancient humans were in fact an especially determined bunch who doggedly forced down hundreds of grams of fibre each day while sitting immersed in a pungent green cloud, then they sure as heck weren’t doing it as part of a low-carb diet.

Again, let’s look at the figures: Even if our ancestors were getting this alleged fibre solely from very low carbohydrate plants similar to something like our modern broccoli (which contains a mere 6.64 grams of carbs per 100 grams of raw weight), then a 100-300 gram fibre intake would have translated to a daily carbohydrate intake of 255-766 grams![24]
And if they were getting these fibre intakes from fruits and tubers (foods that many hunter-gatherer populations have been documented to eat), then Stone Age humans were consuming the kind of carbohydrate intakes that would make the average pro cyclist’s diet look downright ketogenic!
Lustig might not like carbs, but according to his own fantasmagorical fibre figures, the Stone Age humans he longingly cites sure as hell did.
Again, Lustig needs to get his story straight. Are carbs an evolutionary incorrect food that make us fat, or were Stone Age humans gorging on ungodly amounts of them in order to obtain ungodly amounts of fibre?
Dodgey Lustig Claim: Humans Ate Up to 300 Grams of Fibre Daily.
Verdict: Most Likely Bullshit; If these massive fibre intakes were alleged to have come from a low-carb diet, then definitely bullshit.
“The Biochemistry”
At 42:20 of the video, Lustig grandly announces “Now to the biochemistry”. This heralds the segment of the lecture where Lustig actually discusses the biochemistry of fructose metabolism, instead of merely spitting out dodgey anecdotes about sugar and fructose.
Upon announcing his impending foray into biochemistry, Lustig proceeds to warn the audience that what follows is going to be dry, heavy and probably beyond their comprehension.
“If you’ve studied biochemistry, you will have an anaphylactic reaction. If you haven’t studied biochemistry, you will fall asleep”, warns Lustig. “So what I’m going to suggest you all do is let me do my thing, to show you that at least it works, and just count the arrows.”
Translated: “Most of you will have no clue what I’m talking about, so just trust me on this.”
Which, evidently, is what many viewers have been happy to do.
An especially regrettable example is the comment left on the UCTV website by one viewer, who writes:
"I didn't necessarily understand the bio-chemistry portion of the lecture, but it still made its point.”[25]

What the … ? You did not understand what he was saying during the biochemistry section of his lecture, yet it still convinced you that sugar is “toxic”?
Sweet Jesus.
Then there’s TIME Magazine’s willingness to help Lustig bypass people’s critical thinking faculties. In a 2011 online piece at the TIME website titled "5 Highlights from the 'Toxic Sugar' Video", the unnamed author/s write, "We watched it, so you didn’t have to."[26]
Are you serious?
Let’s see: Think for myself, or let TIME Magazine do it for me?
Gee, that’s a hard one.
To help make my mind up (actually, it’s already made up, but let’s humour these jokers for a moment) ... TIME, may I ask you something?
Aren’t you the same pack of geniuses responsible for this famous piece of stupidity, which helped kick the idiotic war against cholesterol into overdrive?

Only to bring us the following, just a few years ago?
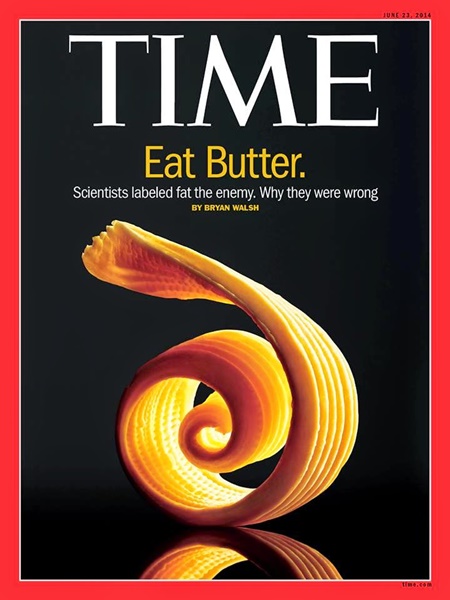
Stay tuned for 2040, when a gigantic 100-trillion dollar mega-study involving research centres from North America, Europe and Australia reports the earth-shattering finding that the obesity epidemic was caused, not by sugar, but by … wait for it … too many calories and not enough physical activity! TIME will no doubt respond with a cover featuring the shocking revelation:
“SUGAR: Why it can’t make you fat unless you eat too much of it!”
Dear TIME Magazine: You truly have no clue. Thanks for offering to do our thinking for us – but I strongly recommend interested parties watch Lustig’s video for themselves and come to their own conclusions.
Anyways …
Lustig begins his biochemistry discussion with the following stunning revelation:
“Fructose is not glucose.”
No kidding. Just like Coke is not pizza.
Lustig then goes on to assert that:
-Fructose is more prone to glycosylation than glucose;
-Fructose does not suppress grehlin, nor does it stimulate acute insulin or leptin;
-Fructose is metabolized differently in the liver than glucose.
Lustig also claims that “Chronic fructose exposure promotes the metabolic syndrome.” The term “metabolic syndrome” is a catch-all tag applied to folks displaying at least three of the following five: abdominal (central) obesity, elevated blood pressure, elevated fasting plasma glucose, high serum triglycerides, and low HDL levels.
The next thirty-four minutes are devoted to elaborating on these points, with lots of big words and, yes, countless arrows.
Much of what Lustig says about the biochemistry of fructose is, technically speaking, correct. However, the context in which he cites this information and the inferences he makes from it are shadier than the southern end of Melbourne’s King Street at 2am on a Saturday morning.
Fructose, Glucose, Sugar, or Carbohydrates?
If you follow Lustig’s commentary over time, he seems to have a rather confused stance on just what type of carbohydrate is “evil” and caused the obesity epidemic. Depending on what show he’s on, and sometimes even in the same show, he alternately cites carbohydrates, sugar, or fructose. He also does this repeatedly during his "Bitter Truth" lecture.
The category of “Carbohydrates” includes a heck of a lot more than just refined sweeteners; it covers everything from the most complex of starches to the simplest of sugars. In terms of actual foods, it includes everything from beetroots to bananas to blueberries to bread, from potatoes to pasta to peaches to pumpkin, from corn to carrots to croissants, from apples to arepas to apricots to … okay, I think you get my point.
Sugar, meanwhile, is typically used to refer to table sugar, aka sucrose. And sucrose is a 50/50 compound of glucose and fructose. HFCS is also a mix of glucose and fructose, the two most common varieties containing 42% and 55% of fructose.
So Lustig spends a lot of time labelling sugar as “evil”, “toxic”, and a “poison”, but then turns around and starts banging on about fructose, and it how it allegedly possess traits that make it far worse than glucose.
But the overwhelming majority of refined sweeteners in the modern food supply are in the form of sucrose or HFCS, where glucose and fructose unavoidably occur together. While fructose and glucose are sometimes added to foods in isolation from each other, they don’t even come close to being used with the same frequency as sucrose or HFCS.
So again, Lustig’s commentary is inherently confused. Whether he wants you to avoid carbohydrates in general, or sugar, or to simply shun fructose but keep eating glucose, seems to depend on his mood at any given moment.
Needless to say, the terms “carbohydrate”, “sugar (aka sucrose)”, “fructose” and “glucose” are not freely interchangeable. They are distinct terms, the first all-encompassing, the latter three referring to substances of unique and clearly defined composition.
But no matter: The title of his video explicitly mentions “Sugar”, while the biochemistry section of his video deals mainly with fructose, so we’ll address both here.
We'll start by dismantling Lustig’s anti-fructose claims. Don’t worry – I won’t be asking you to just “let me do my thing”, then attempt to impress/baffle you with a tsunami of technical terms and a mountain of criss-crossing arrows that resembles a Pick-Up Sticks game.
When you cite the kind of science that really matters – i.e. controlled studies with real live human beings – you don’t need to resort to that kind of carry on.
Fructose and Glycosylation
So let’s start with Lustig’s assertion that fructose is more prone to glycosylation (a.k.a. glycation) than glucose. This is true - in laboratory experiments conducted inside glass receptacles.
But what about in real live human beings? From the lab experiments, Lustig wants you to make a leap of faith and assume that when real live humans consume fructose, it sends their in vivo (inside the body) production of advanced glycosylation end-products (AGEs) into overdrive.
But does it?
No.
What does greatly increase AGE production is high blood glucose. Vegetarian diets, despite their alleged ‘healthy’ status, also increase AGE production.
The effect of high blood glucose (read that again: blood glucose) on glycosylation, and the increased presence of AGEs in diabetics is so well documented I won’t even waste my time discussing it here, but if you want a reference, here it is:
Pubmed.
What I will quickly discuss here is vegetarianism which, like low-carbing, is a ridiculously overhyped load of shit that completely fails to live up to all the exuberant claims made for it. Comparisons of omnivores and vegetarians found the latter to have far higher levels of AGEs, a finding that could not be explained by differences in blood glucose levels, kidney function or total carbohydrate intake[27,28]. The researchers who made these observations thus concluded that the results must have been due to higher consumption of fructose-containing fruits and vegetables in the vegetarians.
If you find the claim that fruits and vegetables are unhealthy and ramp up the formation of destructive AGEs a bit smelly, then congratulations! You’re one of the small percentage of people left on this planet that can evidently still think for themselves and maintain healthy levels of skepticism. As well-intentioned as the researchers’ speculations were, they were wrong - as demonstrated by research with real live human beings (not petri dishes) who were fed either glucose or fructose and then monitored for any change in their AGE status.
Fructose and Glycosylation - The RCT Research
AGEs can occur in foods as a result of exposure to high cooking temperatures. And so to see if manipulation of dietary AGE levels had any effect on urinary AGE levels (lower levels indicating less exposure to AGEs), seventy-four overweight women were randomized to follow either a high- or low-AGE diet for 4 weeks. The high-AGE group was instructed to fry, bake, roast, or grill their foods; to consume toasted bread with a crust; and to choose foods with a high content of AGEs based on a provided food choice list. The low-AGE group was instructed to boil or steam their food, to consume bread without a crust, and to choose foods with low content of AGEs from the same food choice list.
But the intervention did not stop there. As well as examining the effect of dietary AGEs, the researchers wanted to see if fructose increased in vivo formation of AGEs. And so each volunteer was also provided with 84 bottles containing 20 g fructose or 22 g glucose monohydrate powder in a double-blinded manner. They were instructed to consume three sugar supplements daily in connection with main meals, after dissolution of the powder in water. They were instructed not to consume additional added sugar, and sugar-containing foods were prohibited.
Before I report the results, I want to add an important note here: Don’t construe the above as confirmation that you should begin an all-raw diet or adopt a bland diet of boiled steak and trimmed toasted bread. While there is plenty of evidence to indicate excessive in vivo AGE production as a result of pathologically high blood sugar levels leads to tissue damage and premature aging, whether consumption of pre-formed dietary AGEs causes such damage is still highly speculative (and questionable).
But anyways … at four weeks, the low-AGE diet did indeed decrease urinary AGEs, fasting insulin concentrations, and insulin resistance, compared with the high-AGE diet.
However, there were no differences in any of these variables, including urinary AGE levels, between the glucose and fructose treatments[29].
Which fails to support Lustig’s rantings that consuming fructose will turn your body into the equivalent of a massive, golden-brown leg of glazed ham.
And vegetarians? If fructose doesn’t increase AGE production, then why do they display higher levels of AGEs?
Because they avoid meat, which is by far and away the richest source of an important amino acid called carnosine.
And guess what carnosine does? Among other things, it prevents formation of AGEs. In fact, in the type of lab experiments that Lustig is so fond of, and in animal studies, carnosine is more effective at this than the anti-glycation drug aminoguanidine[30,31].
Maybe there really is something to the old saying “Vegetarians don’t live longer, they just look older!”

If Lustig truly wants to help people avoid excessive glycosylation, then he needs to stop ranting on about fructose and glazed ham, and start focusing on the things that have been documented to increase AGE production in human beings: High blood glucose (again, that’s spelt –g-l-u-c-o-s-e, not f-r-u-c-t-o-s-e) and avoidance of meat.
What are the best and scientifically documented non-drug ways to lower high blood glucose? Weight loss via calorie restriction, exercise, and reduction of bodily iron stores. Lustig does everything he can to discourage people from the first two by falsely claiming they are useless, and ignores the third.
Way to go, Robert.
Fructose and Satiety
Lustig spends a lot of time talking about two satiety-related hormones: Leptin and grehlin. I tend to roll my eyes and yawn when anyone mentions leptin - not because it isn’t important, but because there’s little you can do to directly manipulate leptin levels in order to trigger weight loss. Several years back leptin was a red hot topic that spawned numerous books and countless internet articles, and it still continues to be discussed fervently in some quarters. But I’m guessing the actual amount of body fat lost worldwide as a result of all this leptinmania wouldn’t even fill a thimble.
Even direct injections of leptin seem to have little effect. While one early study in which obese subjects were injected with leptin showed greater weight loss in a dose-dependent manner[32], subsequent studies have failed to find any difference[33-36].
Bottom line: Carrying on about leptin produces little weight loss, but creating a caloric deficit through diet and exercise works a treat, which is why The Fat Loss Bible focuses on the latter strategy and ignores the first.

Of course, Lustig absolutely despises the whole idea of people stepping up, taking responsibility for their own adiposity, and reversing their overweight via caloric restriction and/or exercise.
And so he launches into the Fructose-Leptin-Grehlin Theory of How the World Became Overweight™. Once again, he uses a barrage of arrows and big words. And once again, he ignores the actual controlled clinical research involving real live human beings that rises above all this metabolic minutiae and instead looks at the big picture.
And the big picture is this: Regardless of what fructose does in short-term lab experiments, it causes no difference in actual caloric intake when administered in real life doses to living breathing Homo sapiens in randomized clinical trials. I say “real life”, because the research Lustig cites about fructose, grehlin and leptin involved pure fructose, not the glucose+fructose mixtures typically consumed in everyday life.
Let’s check out the RCTs involving more realistic fructose-containing solutions, and see what they showed.
The Clinical Trials
In the pre-amble for their 2007 paper, Kathleen Melanson and her colleagues summed up the fructose-leptin-grehlin brouha, and why most of the research cited by folks like Lustig was problematic:
"Fructose has been implicated in obesity, partly due to lack of insulin-mediated leptin stimulation and ghrelin suppression. Most work has examined effects of pure fructose, rather than high-fructose corn syrup (HFCS), the most commonly consumed form of fructose."
Melanson and her team set out to address this lack of relevant research by comparing the effects of drinks sweetened with HFCS or sucrose on blood glucose, insulin, leptin, ghrelin, and appetite.
Thirty lean women were studied on two randomized 2-day visits during which HFCS- and sucrose-sweetened beverages were consumed as 30% of energy on isocaloric diets during day 1 while blood was sampled.
On day 2, food was eaten ad libitum (i.e. as much or as little as the subjects liked). Subjects rated appetite at designated times throughout the day.
The results?
No significant differences between the two sweeteners were seen in fasting plasma glucose, insulin, leptin, and ghrelin. Nor were there any differences in energy or macronutrient intake on day 2[37].

This study fails to support all those shrill claims that HFCS possesses some unique, obesity-enhancing trait. To those of us with a modicum of commonsense, the results come as no surprise because sucrose and HFCS contain similar proportions of glucose and fructose. But what happens when the ratio of glucose:fructose is deliberately altered?
That question was addressed in a study by Akhavan and Anderson, in which healthy young men aged 18–35 y with a BMI between 20 and 26 were randomly assigned to receive 1 of 6 sugar solutions at weekly intervals. The sugar in these solutions was either HFCS, sucrose, or a blend of glucose/fructose whose ratio varied from G20:F80 to G80:F20. Two control solutions were used; one was a sweet energy-free control that contained water sweetened with sucralose, the other was plain water.
The sugar solutions all provided 300 calories in 300 ml of fluid.
At each experiment, the subjects first drank the assigned sugar or control solution. Eighty minutes later, they were then presented with pizza (McCain Foods) and water, which they were told to consume ad libitum.
To see what, if any, affect the solutions had on subsequent food intake, the researchers measured the caloric intake consumed by each subject at each pizza meal.
The researchers found that all sugar solutions except the G20:F80 and G35:F65 solutions suppressed food intake at the subsequent pizza lunch significantly more than the water control[38].
In other words, the only sugar solutions that failed to suppress appetite were those containing fructose in disproportionately high amounts (65-80%) – that is, in the kind of ratios not found in typical Western foods and beverages.
In an experiment by Monsivais et al, thirty-seven volunteers (19 men, 18 women) aged 20–29 consumed isocaloric cola beverages (215 calories) sweetened with sucrose, HFCS 42, or HFCS 55. Diet cola (2 cal), 1%-fat milk (215 cal), and no beverage were the control conditions. The five beverages were consumed at 10:10 (2 hours after a standard breakfast). The participants rated hunger, thirst, and satiety at baseline and at 20-min intervals after ingestion of the drinks. At 12:30, a tray lunch containing a total of 1708 calories was served to each subject, and energy intakes were measured.
The researchers observed no differences between sucrose- and HFCS-sweetened colas in perceived sweetness, hunger and satiety profiles, or energy intakes at the subsequent lunch. All four caloric beverages tended to partially suppress energy intakes at lunch (the effect was statistically significant only for 1%-fat milk, whereas the no-beverage and diet beverage conditions did not[39].
In a study by Stanhope et al, thirty-four men and women consumed 3 isocaloric meals with either sucrose- or HFCS-sweetened beverages; eight of the male subjects were also studied when 100% fructose- or glucose-sweetened beverages were consumed.
The results showed that 24-h glucose, insulin, leptin, ghrelin, and triglyceride profiles were similar between days that sucrose or HFCS was consumed. In the men in whom the effects of all four sweeteners were compared, the 24-h leptin and grehlin responses showed no consistent pattern; glucose resulted in higher leptin response, while sucrose (which is 50% fructose) produced the lowest grehlin levels[40]. At any rate, these disparate differences were not statistically significant.
There are a couple of things that are interesting about this study. Not only did this study directly compare HFCS and sucrose with 100% fructose and 100% glucose, it was conducted by researchers who had previously performed some of the earlier research showing pure fructose to cause less grehlin suppression and leptin stimulation than glucose[41]. Lustig loves to cite that early research, but makes no mention of this later study – nor any of the above studies – despite the fact they were all published prior to his 2009 anti-fructose lecture.
Which can only mean one of two things:
-Lustig knew about the above studies, but avoided citing them because they failed to support the anti-fructose thesis that has become his very lucrative hallmark, or;
-He honestly did not know about these studies. I find this hard to believe, because anyone with access to the Internet can easily pull them up on Pubmed using very basic keyword searches like “fructose and satiety”, “fructose and leptin”, etc. If Lustig truly did not know about these studies, then I’d say we have every right to seriously question his competence as a researcher.
Dishonesty or incompetence, the end result is the same: A bunch of falsehoods erroneously being served up as fact. As Timothy H. Moran, from Johns Hopkins University School of Medicine, noted in a 2009 review: "On balance, the case for fructose being less satiating than glucose or HFCS being less satiating than sucrose is not compelling."[42]
Not compelling at all.
Dodgey Lustig Claim: Fructose, when consumed in realistic quantities and ratios, increases appetite.
Verdict: Bullshit
Fructose and Actual Weight/Fat Loss
Lustig claims carbohydrates/sugar/fructose (again, take your pick) caused the obesity epidemic. And in a 2013 interview, he specifically claimed carbohydrates are fattening independent of their caloric content[13]. But metabolic ward studies comparing isocaloric diets of varying macronutrient content have repeatedly shown no fat-derived weight loss advantage to low-carb diets.
So carbohydrate avoidance does not somehow miraculously obliterate the Laws of Thermodynamics, but what about sugar/fructose avoidance?
Welcome to the Real Ward
With the publication of The Fat Loss Bible, I introduced many people to the concept of metabolic ward studies, and why they were the only reliable test of claims that low-carbohydrate diets produced greater fat loss at isocaloric intakes.
The reason is simple: In free-living studies, where participants are told to follow a particular diet while going about their normal daily routine, researchers simply have no way of knowing for sure whether the participants actually ate the specified number of calories.
Which is a truly fatal flaw in any study purporting to examine the effect of manipulating dietary macronutrients while supposedly keeping overall caloric intake constant.
Which is why we need ward studies. In these types of studies, the participants live in research facilities for the duration of the study and their food intake is limited to what is supplied to them by researchers.
While the results of free-living studies comparing low-carb and higher-carb diets are a mixed bag, the results of metabolic ward studies overwhelmingly show no difference between the two in weight and fat loss (with the exception of the notorious Kekwin and Pawan study, and two very poorly conducted and reported studies by Rabast et al which, laughably, low-carbers gushingly cite while ignoring the plethora of non-supportive ward research).
So now it’s time to apply the ward filter to sugarphobia. To find out if there is something inherently fattening about sucrose and fructose, we need to examine the results of metabolic ward studies in which subjects consumed isocaloric diets varying in their sucrose and fructose content.
The Ward Studies - Fructose
So far, I've been able to dig up three ward RCTs involving isocaloric diets and specifically examining fructose. In one of these studies (Thorburn et al), the sucrose content of the diet was replaced by fructose, giving a daily fructose intake of 76-124 grams. The researchers reported no difference in weight change on either diet, but "all diets were adjusted to maintain body weight" throughout the study[43]. By how much the researchers had to adjust calories on each diet, and if there were any differences in the required adjustment, was not discussed.
Turner et al studied subjects with hypertriglyceridemia at the Clinical Research Center of the University of Washington Hospital, Seattle. All subjects were male, three were significantly above ideal body weight, and two had diabetes. During the eight to 10 week hospitalization period, the subjects were fed 4 different liquid formula diets, the caloric content designed to maintain body weight. The study was divided into four phases, with each subject spending at least 2 weeks on each diet.
In two of the dietary periods, the isocaloric formula diet contained 45% carbohydrate (dextromaltose), 40% as fat (one-half butter fat and one-half corn oil), and 15% protein (dried milk powder). For the other two dietary periods, the formula contained no fat, 85% of calories as carbohydrate, and 15% as protein.
During one of the dietary periods with the fat-containing diet and one with the fat-free diet, substitution was made with fructose for 20% of the carbohydrate calories. Thus, with the 45% carbohydrate diet, the fructose consumed per day ranged from 33 to 46 g, and with the 85% carbohydrate diets, the fructose consumed ranged from 90 to 154 g/day, depending on the caloric intake of the individual.
Mean weight change during the 45% carbohydrate diet period averaged -0.7 kg, and during the 45% carb diet with fructose -0.3 kg. Mean weight change during the high carbohydrate diet period averaged -0.5 kg, and during the high carbohydrate diet with fructose, -0.6 kg[44].
For those interested, Thoburn et al found "no deleterious changes in lipid metabolism after fructose supplementation. The fructose diet produced no changes in serial free fatty acids ... total cholesterol ... high-density lipoproteins ... low-density lipoproteins ... VLDL-TG production ... and fractional catabolic rate".[43]
Turner et al, meanwhile, found "dietary fructose given for several weeks does not appear to cause further elevations of plasma triglyceride levels in hypertriglyceridemic men".[44]
To be quite honest, I have little interest in these lipid changes; as I've detailed at length in The Great Cholesterol Con, the lipid theory of heart disease constitutes one of the biggest shams in modern medicine. Talking and writing about these changes is, in my opinion, a waste of breath and space. Nevertheless, Lustig spends considerable time banging on about triglycerides and the various lipoprotein sub-fractions and how fructose allegedly alters them for the worse, so I'm mentioning them here to allow readers to see yet again just how far his version of events departs from scientific reality.
The third study was conducted by researchers from the University of Helsinki, Finland, and involved ten type 2 diabetic patients (6 women, 4 men, mean age 61, BMI 27.5). This was a double-blind, randomized cross-over endeavour with two 4-week in-patient phases with a 1 month washout interval. Each patient was admitted to the metabolic ward of the Helsinki University Central Hospital and placed on an isocaloric weight-maintaining diet providing 50% of calories from carbohydrate, 30% from fat and 20% from protein.
During the fructose period, 20% of total carbohydrates were replaced with fructose, the rest being complex carbohydrate. The fibre content was similar
in both diets (25-30 g/day). The total daily amount of fructose varied from 45 g to 65 g per patient, depending on the patient's total caloric consumption.
The results?
Body weight remained unchanged during the fructose and the control phases.
Blood pressure was similar before and after the fructose and control diets. The fasting blood glucose concentration fell during the fructose diet from 10.7 to 8.0 mmol/L, and during the control diet from 10.1 to 8.0 mmol/L.
Insulin sensitivity improved on the fructose diet, but remained unchanged on the control diet. Reflecting this improvement in insulin sensitivity, C-peptide levels also fell on the fructose diet.
During the fructose diet, glycosylated haemoglobin (HbA), fell from 9.0% to 8.0%. During the control diet, the HbA, concentration did not change significantly (9.5% vs. 9.1%)[45].
Read that last bit again, folks. Lustig claims fructose increases glycosylation in vivo. Well, HbA is a measure of haemoglobin that has been glycated as a result of exposure to glucose, and it was reduced to a significant degree only on the fructose diet.
For those who care, triglycerides rose slightly but non-significantly on the fructose diet, while levels of VLDL, LDL, HDL, HDL², HDL³, DDT, GT3, and ABC¹²³ remained essentially unchanged. By the way, for all you lazy sods who are copying this stuff for an assignment, I made those last three acronyms up.
And so ward research continually fails to show any meaningful difference between high- and low-sugar diets in blood levels of triglycerides and free fatty acids, putting lie to the ridiculous claim Lustig makes at 1.04:51 of the video:
“When you consume fructose, you’re not consuming carbohydrate. You’re consuming fat!”
Yep - the man who brought us the stunning revelation that “fructose is not glucose” is now trying to tell us that “fructose is fat”.
Hell’s bells.
Once again, when Lustig’s claims about fructose are placed up against the cold, hard, unforgiving light of scientific scrutiny, we quickly see them for what they are: Nonsense.
His rabid anti-fructose stance can only be maintained by selectively citing research of highly questionable relevance. A classic example occurs at 1.05:211, where Lustig discusses a study by Faeh et al, in which healthy students fed fructose for six days saw their triglycerides double, de novo lipogenesis increase five-fold, and their free fatty acids doubled. It all sounds pretty alarming considering the fructose feeding only lasted six days, but here’s what Lustig didn’t tell his audience:
During those six days of high-fructose consumption, the students ate 3 grams of pure fructose per kilogram of bodyweight (the equivalent of 225 grams per day for a 75kg individual) in addition to their normal caloric intake. This massive and unnatural fructose intake meant that the students were eating an extra 800–1,000 calories per day above their normal intake![46] You don't think that if you suddenly started gorging on an extra 800-1,000 calories per day your triglycerides, FFA and DNL wouldn’t increase?
As with most diet ’gurus’, Lustig is a master in the art of selective and irrelevant citation.
The Ward Studies - Sucrose
In 1970, Scottish researchers published the results of a study conducted in the metabolic ward of the Atheroma Research Unit, Western Infirmary, Glasgow. Six men and 3 women, aged from 37 to 62 years, participated in the study. Eight of the patients suffered neurological conditions and one had heart disease. Their disabilities were stable, all could eat normally, and all had normal glucose tolerance.
Following two weeks on a standard ward diet, the subjects were placed on sucrose-rich and sucrose-free diets for 4 weeks each in crossover fashion. Both diets employed a fixed caloric intake, based on each subject's estimated energy expenditure. In five subjects, the ‘sucrose’ period was first, in 6 it was second.
Protein, fat and carbohydrate formed 15%, 40% and 45% of the caloric intake. During the ‘sucrose’ period, 70% of dietary carbohydrate was supplied as sucrose, 22% as starch and 8% as other mono- and disaccharides (glucose, fructose and lactose). Daily sucrose intakes ranged from 118 to 210 g with a mean of 169 g.
During the ‘sucrose free’ period, 85% of dietary carbohydrate was given as starch (wheat or potato starch, plus a small quantity of maize starch) and 15% as the aforementioned mono- and disaccharides.
Changes in weight were small and non-significant (mean change: -0.7kg during the ‘sucrose’ diet, +0.7kg during the ‘sucrose-free’ diet).
Mean fasting blood sugar levels were slightly higher during the ‘sucrose’ period, compared to the sucrose-free period (74.0 versus 70.0 mg/100 ml, respectively). During 50 g glucose tolerance tests, blood sugar levels were slightly higher during the ‘sucrose’ period, but this difference was not statistically significant. Plasma insulin levels were similar during the dietary periods, both in the fasting state and after 50 g of glucose. Mean levels of serum cholesterol (yawn), serum triglyceride and plasma non-essential fatty acids showed no significant differences between the two dietary periods[47].
In 1972, the British Journal of Nutrition published a ward study by Mann and Truswell, from the Department of Medicine, University of Cape Town, Cape Town, South Africa. The study took place in the Groote Schuur Hospital metabolism ward, and the subjects were nine men aged 30-40 years who had been admitted to hospital earlier for non-metabolic conditions. The subjects were given three diets and each dietary period was of 14 days' duration.
Diet 1 provided 15%, 30%, and 55% of calories from protein, fat, and carbohydrate, respectively. Of the carbohydrates, sucrose supplied 23% of daily calories.
In Diet 2, the sucrose of diet I was isocalorically replaced by two complex carbohydrates, potato and rice, so that the amount of total carbohydrate remained unchanged.
In Diet 3, the total calorie content of the diet was reduced by eliminating the sucrose from diet I and not replacing it with other food constituents.
Diets I and 2 were given to the subjects in a random order but diet 3 was always given last.
Mean body-weights were virtually the same at the end of dietary periods 1 and 2. The mean weight for the last 3 days on Diet 3 was, however, significantly lower than on Diets 1 and 2.
Fasting serum insulin concentrations did not differ significantly on Diets I and 2, and there were no significant differences between fasting serum triglyceride concentrations on either diet. However, the mean triglyceride level for the last 3 days on Diet 3 was significantly lower than the mean for the last 3 days on Diets 1 and 2.
Worthy of note here is that Mann et al had previously found in a free-living study that fasting serum triglyceride concentrations fell in healthy male volunteers on a sucrose-restricted diet. They suspected that the mechanism for this reduction may have been a calorie deficit in the low-sugar group because they lost weight at the same time. Hence their ward study.
In the ward study, the fall in serum triglyceride concentration on Diet 3, after values had remained unchanged on Diets 1 and 2, supports the contention that reductions in calorie intake explain the observed differences in fasting serum lipids when complex carbohydrate replaced sucrose. Mann and Truswell reported that “Several of the subjects in the present study felt that they were being given too much to eat when switched from diet I to diet 2. Starch-containing foods are more bulky than sucrose and it is probably difficult for an individual voluntarily to replace all his dietary sucrose with starch.”[48]
In other words, Lustig is erroneously blaming sugar/fructose for causing obesity and metabolic syndrome, when the real culprit is a caloric surplus.
As further ward studies show.
In a study by Abraira and Derler, eighteen diabetic volunteers receiving no medication were given weight maintenance diets with 50 percent carbohydrate, 35 percent fat, 15 percent protein, and 120 grams of sucrose for 10 days as inpatients. They were then randomly assigned diets of similar composition with either 220 grams of sucrose or less than 3 grams of sucrose daily for one additional month. Carbohydrate content of the low-sucrose diet was maintained by increasing portions of foods such as bread, potatoes, and pasta. All subjects were hospitalized in the Special Diagnostic and Treatment Unit at Hines Veterans Administration Hospital, Illinois, for the duration of the study.
By the end of the study, body weight changes were similar on both study diets: -1.51kg and -1.69kg on the high- and low-sucrose diets, respectively.
There were no differences in fasting, one-, two-, and three-hour post-lunch serum glucose levels; 24-hour glycosuria; fasting and postprandial serum triglyceride levels, or fasting HDL cholesterol levels. And despite sucrose being 50% fructose, there were no differences in glycated hemoglobin levels.
Twelve patients with pre-existing hypertriglyceridemia had similar trends, but the postprandial triglyceride levels were lower in the high-sucrose diet group of this subset.
So in this tightly controlled study, a more than 75-fold difference in sucrose intake with constant carbohydrate and fat levels did not affect glycemic or triglyceride control in type II diabetic patients. As the researchers noted, “The reported high sucrose-carbohydrate-induced rise in fasting triglyceridemia was not present when a diet high in sucrose was given without changing total carbohydrate.”[49]
I’ll say it once again: Lustig is blaming fructose/sugar for changes that are in fact being caused specifically by an excess of calories.
Want to lose weight and have good glycemic control? Then the first thing you need to do is create a calorie deficit. As for the latter, lowering bodily iron stores is a powerful strategy that has been documented to improve glycemic control and insulin sensitivity in diabetic and non-diabetic volunteers – one that is roundly ignored by Lustig, the media, and the medical profession in general. To address this discrepancy, I strongly recommend you all stop buying bullshit-laden fat loss books written by fat blokes, and use the money instead to grab yourself a copy of the truly excellent and immensely helpful Exposing the Hidden Dangers of Iron.
Anyway, let’s continue, as we’re not quite done with the ward studies involving sucrose. There’s one more to discuss, and it comes from Italy. Yep, the country where Lustig claims there is no sucrose in the diet.

So far, the ward studies we've looked at involved weight-maintenance diets. Piatti et al, from Milan, investigated the effect of diets with different simple and complex carbohydrate contents on weight loss, insulin function, and lipid levels. Twenty-five obese subjects with normal glucose tolerance were randomly allocated to one of 3 hypocaloric (800 calories/day) diets containing:
-60% high complex carbs/high starch and fibre, 20% fat;
-60% high simple carbs/high natural fibre, 20% fat;
-20% carbs and 60% fat.
The remaining 20% of the diet was protein.
In all cases, the duration of the diet was twenty-one days. All subjects were hospitalized for the duration of the study.
At 21 days, mean weight loss was -4.6kg, and did not differ among groups. Fat-free mass and fat mass also decreased similarly in the three groups, as did total cholesterol, LDL cholesterol, and apo B levels. HDL cholesterol and apo A1 significantly increased only during the high-sucrose diet.
Interestingly, insulin resistance (as measured by euglycemic-hyperinsulinemic clamp) worsened on the complex carbohydrate diet, but not the high-sucrose or low-carb diets. Blood free fatty acid levels significantly increased only after the high-complex carb diet[50].
Once again, sugar was compared to complex carbohydrates under isocaloric conditions and failed to live up to the reigning hysteria. As with fructose, isocaloric exchange for sucrose produces no difference in weight status and no change in triglycerides or free fatty acids. Despite this, at 1.05:02 of the video, Lustig emphatically states:
“A high sugar diet is a high fat diet. That’s the point. That’s EXACTLY the point.”
Once again, Lustig is wrong. EXACTLY wrong.
The Free-Living Studies
Despite their inherent superior quality, there are a couple of limitations with ward studies. Their exacting level of control, the necessary staff, and the need to provide accommodation and food for the participants make them expensive and labour intensive. As such, they are not as common as free-living studies, tend to have smaller sample sizes, and are often limited in duration. While it is not uncommon for free-living diet studies to span 12 months or more, dietary ward studies that last more than a few months are rare.
So it’s worth briefly mentioning the free-living research. Rather than spend another 10,000 words discussing each of these studies, I’ll defer to a systematic review conducted by Te Morenga, Mallard and Mann, which was published in BMJ in 2012. Despite being freely available here, you won't hear folks like Lustig mentioning this review, for reasons that will become obvious shortly.
Te Morenga and her colleagues sought to determine the effect of decreasing or increasing sugar intake on bodyweight. And so they conducted a sweeping review of both the relevant clinical trials and epidemiological (prospective cohort) studies. I personally think nutritional epidemiology is overwhelmingly a load of confounder-prone wankery and won’t waste my time discussing it here, but those interested are free to check out the review for themselves.
As for the RCTs, the researchers uncovered nineteen that met the inclusion criteria for ad libitum studies, and 11 for isocaloric studies. Unfortunately, there were no RCTs at the time of publication involving children, only cohort studies.
Increased intake in dietary sugars was associated with significantly greater weight (+0.75 kg) at the end of the intervention period by comparison with no increase in sugars intake. The studies involved an increase in dietary sugars; mostly sugar sweetened beverages, in the intervention arms of the RCTs. Only two of these studies lasted longer than eight weeks; analysis of these two longer-term studies revealed a greater weight gain (+2.73 kg) than the pooled effect for the shorter term studies (+0.52 kg).
It shouldn’t take a genius to work out why these results are at odds with the above-mentioned ward studies. When Te Morenga et al pooled the results from free-living studies involving isocaloric exchange of dietary sugars with other macronutrients, they found "no evidence of difference in weight change as a result of differences in sugars intakes when energy intakes were equivalent." These studies lasted from two weeks to 6 months, and the studied sugars were in the form of either sucrose or fructose, which were used to sweeten foods or liquids.
So even the free-living studies are in agreement with the ward studies – there is nothing inherently fattening about sugar independent of its caloric content. As Te Morenga et al concluded, “The change in body fatness that occurs with modifying intakes seems to be mediated via changes in energy intakes, since isoenergetic exchange of sugars with other carbohydrates was not associated with weight change.”[51]
There’s something else I’d like to point out about these results. In the ad libitum studies where weight gain occurred, the increased sugar intake was usually in the form of sweetened beverages. Those of you who’ve been following my work for any length of time will know that I advise against the consumption of sugar-rich beverages (and that includes fruit juices, not just sports and soft drinks) at all times except during and immediately after vigorous exercise.
When consumed during and after exercise, high-GI carbohydrates improve performance, delay fatigue, and even prevent the immune suppression often seen in athletes drinking plain water. These effects are well-documented, but once again you won’t hear folks like Lustig acknowledging this beneficial research because it doesn’t serve their anti-sugar agenda.
Outside of exercise, however, sugar-rich beverages serve no useful purpose (except as an emergency treatment for individuals suffering severe hypoglycaemia). They supply excess calories at a time when they are not needed, and a bolus of readily-absorbed, blood glucose-spiking carbs at a time when blood sugar levels should otherwise be gently cresting from the previous meal.
If you don’t want to suffer the negative consequences of consuming these beverages away from exercise, then here’s my revolutionary, ground-breaking solution:
Don’t consume these beverages away from exercise.
Yeah, I know, that involves using traits such as commonsense and self-responsibility, and some of you may even need to muster up a modicum of willpower but, c’mon folks, we’ve already been through this:
Act like a grown-up, or keep being a whining little piss-ant who rabidly evades reality and blames his/her overweight on anything and everything except his/her own actions.
The choice is yours.
Dodgey Lustig Claim: Fructose and sugar, independent of their caloric content, make you fat, increase triglycerides, cause metabolic syndrome, yadayadayada.
Verdict: Bullshit
The Rest of the Video
The remaining thirty or so minutes is pretty much more of the same: Full of intelligence-lowering hogwash.
His repugnant “fructose is the same as ethanol” stance gets an airing - a stance I’d just love to see him attempt to justify in person to an innocent victim of alcohol-fueled violence, or the loved ones of someone who died after being hit by a drunk driver.
He pooh-poohs the idea that exercise causes weight loss by burning calories, and even proclaims at 1:12:46 that burning extra calories to lose weight is “the stupidest reason I’ve ever heard of for exercising!” Judging by his prodigious waistline, this is a misbelief Lustig clearly lives by.
“You gotta be joking me!” continues the rotund non-exercising one. “You can’t do it!” (Speak for yourself Robert, because I can, and I do. And it’s a major reason why I can eat like an animal and yet remain much, much leaner than you).
“One Big Mac and you gotta, you know, mountain bike for ten hours!” claims the incredulous Lustig, to the laughter of an audience who clearly wouldn’t know blatant bullshit even if it climbed up their necks and pissed in their ears.
Numbers time again: A Big Mac contains 563 calories[52], while in ten hours of mountain biking a 75 kg individual would burn off a mighty 6,375 calories. Competitive and serious road cycling burns even more, which should give you some idea of why pro cyclists can eat 5,000 calories per day yet remain leaner and fitter than any chubby low-carb guru in the entire history of chubby low-carb gurus[53,54].
Dodgey Lustig Claim: Burning calories via exercise is useless for weight loss: “You gotta, you know” mountain bike for ten hours to burn off a Big Mac!
Verdict: Bullshit.
At 1.13:12, Lustig states outright “…fructose is a poison. I think I’ve hopefully shown you that.”
The only thing Lustig has shown us is that he is, without question, a pathological bullshitter.
At 1.16:03, Lustig announces, “That’s the end of the biochemistry. Whew. How’d I do?” to which the audience responds with applause and even a “woohoo!” or two.
Which tends to confirm something I’ve always maintained about human beings: They love bullshit.
And nowhere is this more evident than in the diet and health arena. I’ve been involved in various specialized fields of endeavour in my life, everything from cycling, MMA, boxing, weight training, rock climbing, to airbrush art, and I can say without doubt the lowest average level of functional intelligence I’ve come across is displayed in the nutrition and preventive health fields. No other field displays the same penchant for readily embracing false and counter-productive bullshit. There may not be nearly as many PhDs in a fighting gym or scaling the crags, but these latter activities have some pretty powerful built-in bullshit-blockers that sitting in a university lecture hall can never replicate. In boxing or MMA, for example, a stubborn insistence on doing shit that doesn't work will get you knocked out. In a field like outdoor rock-climbing, embracing pseudoscientific bullshit with no basis in reality would see you very dead, very quickly. Unlike the diet and health arenas, there's no hiding behind mounds of cherry-picked pseudoscience in these types of activities. You do what is proven, effective and safe, or you suffer the consequences very quickly.
No other field I’ve encountered, aside from religion itself, exhibits the religious-like zealotry and the enthusiastic abandonment of rational and critical thinking that is par for the course in the diet and preventive health sectors. Cyclists might disagree about the optimal crank length or whether SRAM is better than Shimano is better than Campy, but they don’t start trolling each other, sending each other thousands of spam emails, posting false accusations about each other, nor threaten to slash each other’s throats about it.
I’m not sure why so many people feel the need to be so completely fuckwitted about diet, but folks, you really need to stop being so stupid about this stuff. It doesn’t do you any favours, and it merely serves to further encourage rampant bullshitters like Robert Lustig and his ilk to pump out even more poppycock.
Lustig's Bullshit Pièce de Résistance
At 1.26:17, Lustig rolls out the old favourite slogan of deluded low-carbers worldwide:
"A calorie is NOT a calorie!"
Really? Then what the hell is a "calorie", exactly? A purple pumpkin? A flying antelope?
A few moments after this piece of intellectual brilliance, Lustig hits his audience with the biggest lie he has spouted so far. After again claiming that eating less and exercising more does not work for weight loss, he unleashes the audacious claim that "All the studies show it does not work."
The guy must be deluded. Truly, truly deluded.
Creating a calorie deficit through reduced caloric intake and/or increased caloric expenditure has been shown time and time again to work. If Lustig started reading the actual research instead of sitting around crafting up fanciful bullshit, he might discover this for himself.
Decades upon decades of ward and free-living studies, published in major medical journals, have clearly documented weight and fat loss in people randomized to reduce their caloric intake and/or increase their physical activity. For Lustig to claim this research doesn't exist completely obliterates whatever remaining shred of credibility the guy clings to.
Perhaps Lustig can take time out from making up more nonsense about Italian and Japanese folk, and read a recent review specifically examining diet plus exercise for weight loss and weight maintenance. After sifting through the literature, Kouvelioti et al came across fourteen relevant high quality trials. The pooled data showed a weight loss of 11.1 kg (about 13%) after an average of about 4 months from baseline[55].
Think about that, Robert. In only four months, you can make some serious inroads into getting rid of that extra 45 pounds of chub you admitted to carrying in a 2014 interview. "I'm not a fitness guru," you said. No shit. But you don't need to be a "fitness guru"- you need to be a participant. You just need to get off your ass and do it.
Which, of course, you won't. You have a very lucrative gig going on, and it is based on denial.
Which is a shame, because if you lost weight via exercise and dietary restraint, you'd become much fitter, look a whole lot better, and feel a damn sight healthier. Then maybe you could divert the abundance of terribly misguided angst you harbour towards sucrose, fructose and those of us relaying the plain facts about calories towards instead telling people the truth: A calorie deficit is the only way to lose weight.
Go ahead: Prove me wrong. Conduct a ward study that demonstrates fat-derived weight loss in people who did not eat below their verified maintenance caloric expenditure. If you can demonstrate a weight loss method that works without creating a calorie deficit, then I'll happily pull this article from the net and start a Robert Lustig Fan club. Ditto if you can conduct a ward study in which the participants maintained their weight despite burning at least 500 calories per day above this verified baseline EE.
If you want, I can save you the time and expense and tell you what the results of these studies will be:
Failure.
Because every weight loss method on the planet that has ever shown even a modicum of efficacy involves re-balancing the calories in vs calories out equation:
Calorie restriction: Induces weight loss by reducing calorie intake to below maintenance calorie needs;
Exercise: Induces weight loss by increasing average daily calorie expenditure until it exceeds daily calorie intake;
Bariatric surgery: Reduces food and hence calorie intake;
Thermogenic drugs (ephedrine, clenbuterol, etc): Increase calorie expenditure via increases in resting metabolic rate, can also suppress appetite;
Appetite suppressing drugs: Suppress appetite, hence reduce caloric intake;
Fad diets: Restricting specific foods or food groups, hence reducing caloric intake;
Restricting or avoiding fat and/or carbohydrates: Reduces caloric intake as a result of avoiding or minimizing intakes of these macronutrients;
Increasing dietary protein, and/or low-GI carbs: Can sometimes (not always) increase satiety, hence reducing caloric intake;
Laxatives, bulimia (NOT RECOMMENDED): Stimulates excretion/expulsion of calories before they have had a chance to be digested and utilized by the body.
I could go on and on, but you should get the picture by now.
Whether it's diet, exercise, drugs, or chanting to the gods while dancing around a giant lolipop, if you lost weight you did it by altering the calories in:calories out (CICO) ratio and creating a calorie deficit.
Sorry Robert, but that's the reality.
So my advice, again, is to haul your ass out of your chair, get on a bike, and start working up an honest sweat. To speed things up, maybe drink a little less red wine (fructose is not alcohol, but alcohol is. And alcohol contains 7 calories per gram compared to fructose's 4 cals/g).
There's just one catch: You'll need to do this for the rest of your life. Don't be like these obnoxious old jocks that wank on and on about what muscular studs they were "when I was your age", while their bulging guts heave up and down from the effort of talking. That shit is just not cool.
As the above review showed, while subjects lost 11.1kg during a mean intervention period of 4 months, post-intervention weight regain of 5.1 kg was seen after an average period of about 21 months. Despite the successful weight loss (the subjects still maintained a weight loss of 5.8 kg), people often use the weight regain seen in long-term studies as an excuse to make themselves feel better about their own lack of intervention by exclaiming "diet and exercise are useless for fat loss!"
That's like dismissing autombiles as "useless for transport" because if you don't keep topping up the oil regularly the engine will run dry and seize up!
What Lustig does when he tells impressionable folks that diet and exercise are useless for fat/weight loss is to ensure they remain ignorant to scientific reality. By spouting this kind of untenable bullshit, he is actively working to make sure as many people as possible do not achieve the weight loss they need.
That Lustig is a victim of his own hogwash is evinced by his appalling physical state. But that's something he'll have to live with. Live by the CICO-denying sword, die by the CICO-denying sword.
But when his blatant misinformation affects the health and lives of others - of those gullible enough to listen to him, people who might otherwise act on scientifcally valid information had he made it available to them ... then that is most unfortunate.
And just plain wrong.
"I've got more YouTube hits than you ... nanananana!"
Back in 2010, a writer by the name of Alan Aragon ran a couple of pieces debunking Lustig’s excursions into dietary fantasy:
http://www.alanaragonblog.com/2010/01/29/the-bitter-truth-about-fructose-alarmism/
http://www.alanaragonblog.com/2010/02/19/a-retrospective-of-the-fructose-alarmism-debate/
After the first of Aragon’s posts above, a “lively” discussion ensued on his blog, to which none other than Lustig chimed in. After unsuccessfully tackling Aragon, Lustig dropped out of the discussion, farewelling with the comment:
"I'll let the public decide who they wish to believe. And thus far, based on the 230,000 YouTube hits and numerous blogs extolling this line of reasoning, I’ll take my chances."
Oh dear.
As Aragon noted, citing one's Youtube hits and popularity among Internet bloggers as a basis for scientific credibility was not a good move. In doing so, Lustig joined a long list of self-aggrandizing blow-hards - including the deluded Michael Eades, the loathsome Janet Brill, and the pathologically obnoxious James Fell – who seem to think that book sales and web hits constitute a marker of scientific accuracy.
What these exceedingly superficial individuals fail to see is that they’ve all been outsold by authors with polar opposite views: Eades by Pritikin and Ornish, Brill by Atkins, Fell by everybody. So by their own line of reasoning, we shouldn’t listen to them, because they are not as popular as others in their field.
Clueless people are funny like that.
Ultimately, the determinant of whether or not we should listen to someone is how correct they are. How well can they analyse and interpret the evidence, and how accurately can they relay the findings and implications of that research to others?
In the case of Robert H. Lustig, the answer to those questions is resoundingly clear:
He can’t.
He appears to make up facts and figures on the spot, running with them and hoping no-one will be none the wiser. And sadly, this ploy has worked on thousands if not millions of people, including hordes of gullible journalists who willingly spread his nonsense farther and wider.
He cites carefully chosen studies and harps on about metabolic minutiae that appear to lend scientific support to his claims, but ignores a vast volume of research that shows his claims to be nonsense.
He makes statements about Italians, Japanese, Coca Cola, pizza, Big Macs, mountain biking - you name it – that are so outrageously false, the mind boggles at the kind of intellect required to accept them without question.
He ventures into insane territory when he claims fructose and sugar are as addictive as heroin and cocaine, and socially destructive as alcohol, again based on research that is quoted wildly of out of context (as I explained in Part 1).
His “Sugar: The Bitter Truth” video is ninety minutes of blatant and easily-disproved bullshit, yet has garnered over six million views - and counting.
It’s times like this I really have to wonder where the human species is headed. A lot of people will believe pretty much anything, and despite all the potential the Internet holds as a tool for getting to the truth, many people instead use it to further fill their heads with crap.
Folks, wake the fuck up.
Seriously.
---
Anthony Colpo is an independent researcher, physical conditioning specialist, and author of the groundbreaking books The Fat Loss Bible, The Great Cholesterol Con
and Whole Grains, Empty Promises.
PS. Other Pearls of Lustig Wisdom
-Lustig’s Life Choices: Fat versus Farting
At 1.14:44, Lustig makes the bizarre statement: “As far as I’m concerned, in life you’ve got one of two choices: Fat, or farting”.
I'm glad I missed that father-son talk.
-A Bunch of Swill about Gatorade
At 1.03:15, Lustig turns his attention to sports drinks. He actually comes tantalizingly close to saying something useful when he notes that sports drink consumption is rampant among people who do not participate in sports. But instead of elaborating and pointing out that non-athletes have no business drinking these high-GI, calorie-rich beverages while sitting at their computers, and that even athletes should only consume these drinks during and immediately after training/competition, he once again floats off into fairyland. This time, it’s to treat us to a bunch of lies about the history of Gatorade.
He claims that in 1992, Pepsi bought Gatorade and asked “How are we going to market this swill?”
According to Lustig’s fairy tale version of events, the answer was to load it with HFCS in order to make it more palatable.
For the record, Gatorade was originally produced and marketed by Stokely-Van Camp, who then sold the Gatorade brand to the Quaker Oats Company in 1983, which, in turn, was bought by PepsiCo in 2000[56,57].
So Pepsi acquired the rights to Gatorade only 5 years ago, by which point the “swill” that Lustig claims is Gatorade was already an international best-seller.
As for the taste issue, the earliest version of Gatorade in 1965, by all accounts, did taste awful. But that issue was solved in … 1965.
Gatorade was formulated by University of Florida kidney disease specialist Robert Cade after being approached in 1965 by then-assistant Gator football coach Dwayne Douglas. He asked Cade about the university's football players’ propensity to lose substantial amounts of weight during practices and games while urinating so little.
Robert Cade and his colleagues thought about it and came up with a solution containing water, sodium, sugar, potassium, and phosphate.
"By all accounts, the first batch tasted so bad none of the scientists could stomach it, but when Cade’s wife suggested adding lemon juice, the drink that would soon become known as Gatorade was born.”
Problem solved. The drink promptly became popular among players, and soon "Stokely-Van Camp was selling hundreds of thousands of gallons of Gatorade annually"[56].
Not bad for “swill”, huh?
However, the real success was yet to come:
“In 1983, the Quaker Oats Co. purchased Stokely-Van Camp and, as UF marketing Professor Richard Lutz describes it, “launched Gatorade from a sleepy little brand into superstardom."
Dodgey Lustig Claim: The commercially savvy PepsiCo, for some strange reason, bought a company that produced foul tasting “swill” in 1992.
Verdict: Bullshit.
Note: The author of this article does not receive and has never received any form of compensation from the sugar industry, soft drink manufacturers, nor any other food industry group.
If You Enjoyed this Post, Please Consider Sending a Tip
I post on my own time and at my own expense. I don't receive a cent from industry, philanthropic or NGO organizations. Researching and writing articles like this takes a lot of time, so any and all tips are greatly appreciated.